📊 Stats & Trend
| ⭐ Stars (total) | 43,793 |
| 📈 Star Growth (Mar 19 → Mar 26) | +43,793 |
| 🔥 Star Growth (Mar 25 → Mar 26) | +43,793 |
| 🔥 Trend | Exploding |
| 📊 Trend Score | 35034 |
| 💻 Stack | TypeScript |
Overview
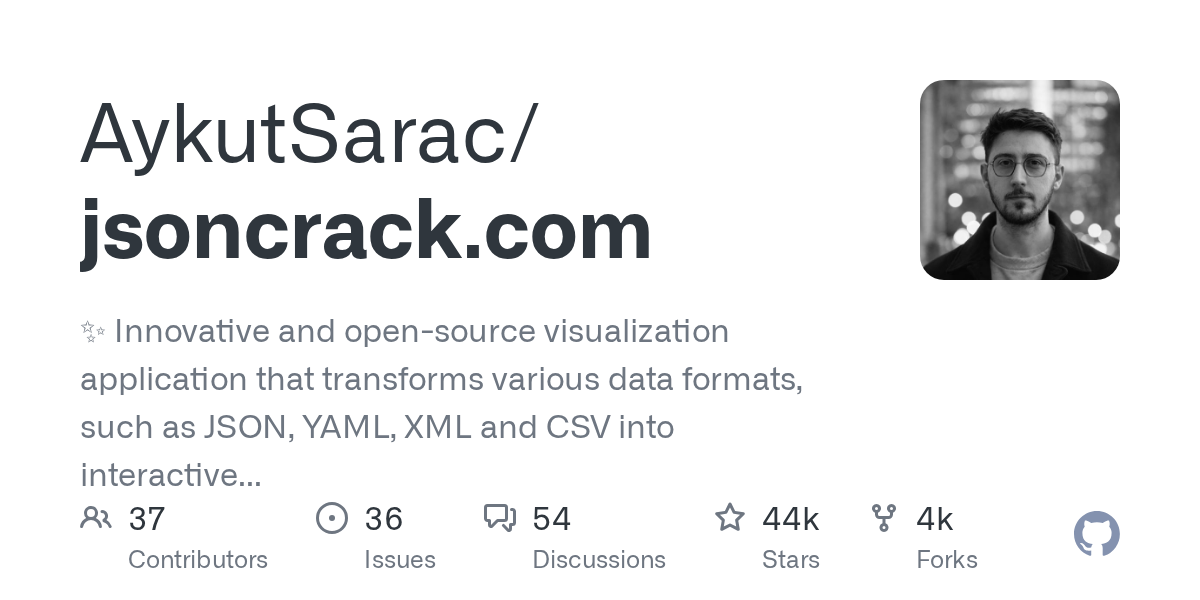
JSONCrack.com has exploded onto the developer tools scene, gaining 43,793 stars in a single week with its innovative approach to data visualization. This open-source application transforms complex data formats like JSON, YAML, XML, and CSV into interactive, visual graphs that make data structure comprehension dramatically easier for developers and data analysts.
Key Features
• Interactive graph visualization that converts nested JSON, YAML, XML, and CSV data into node-based diagrams
• Real-time data parsing and rendering for immediate visual feedback
• TypeScript-based architecture ensuring type safety and robust performance
• Open-source codebase allowing for community contributions and customization
• Multi-format support enabling visualization across different data serialization standards
• Web-based interface requiring no installation or setup
Use Cases
• API response debugging where developers need to quickly understand complex nested JSON structures
• Database schema visualization for teams working with NoSQL databases or complex relational data
• Configuration file analysis for DevOps engineers managing YAML-based deployment configurations
• Data structure documentation for technical teams sharing complex data models with stakeholders
• Educational purposes for teaching data structures and hierarchical relationships in programming courses
Why It’s Trending
This tool gained +43,793 stars this week, showing explosive momentum in developer productivity tools. This suggests increasing developer frustration with traditional text-based approaches to understanding complex data structures. This trend may reflect a broader shift toward visual-first development tools as applications become more data-intensive and API-driven.
Pros
• Dramatically reduces time spent parsing complex nested data structures manually
• Open-source nature ensures transparency and community-driven improvements
• TypeScript foundation provides reliability and maintainability for enterprise use
• Zero-installation web interface makes it immediately accessible to any developer
• Multi-format support eliminates need for separate tools for different data types
Cons
• Web-based architecture may raise security concerns for sensitive proprietary data
• Performance limitations possible with extremely large datasets or deeply nested structures
• Dependency on internet connectivity for web-based version usage
Pricing
Completely free as an open-source project. Users can access the web version immediately or self-host using the available source code.
Getting Started
Visit jsoncrack.com and paste your JSON, YAML, XML, or CSV data directly into the interface. The tool instantly generates an interactive graph visualization that you can explore and navigate.
Insight
The explosive growth suggests that developers are increasingly seeking visual alternatives to text-based data analysis workflows. This momentum may reflect the growing complexity of modern APIs and data structures, where traditional debugging approaches become inadequate. The trend is likely driven by the shift toward microservices and API-first architectures, where understanding data relationships quickly becomes critical for productivity.
Comments