📊 Stats & Trend
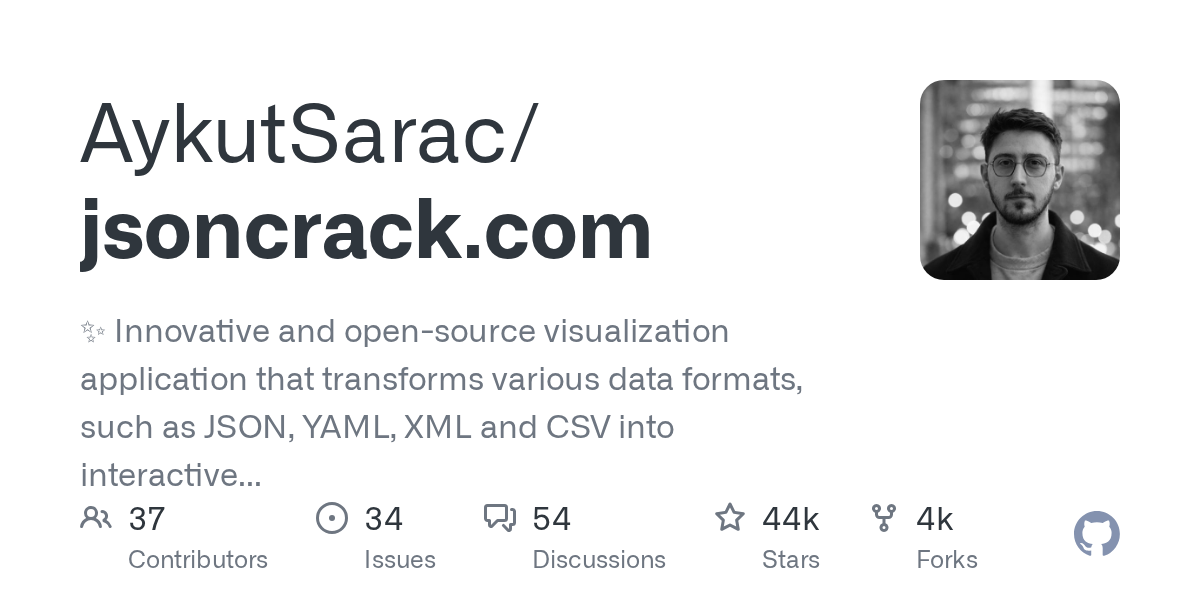
| ⭐ Stars (total) | 43,789 |
| 📈 Star Growth (Mar 18 → Mar 25) | +43,789 |
| 🔥 Star Growth (Mar 24 → Mar 25) | +12 |
| 🔥 Trend | Exploding |
| 📊 Trend Score | 35031 |
| 💻 Stack | TypeScript |
Overview
JSONCrack.com has experienced explosive growth, gaining 43,789 stars with a trend status of “Exploding” as developers seek better ways to visualize complex data structures. This open-source visualization tool transforms JSON, YAML, XML, and CSV files into interactive graphs, addressing a critical pain point for developers working with nested data formats.
Key Features
• Interactive graph visualization that converts text-based data formats into visual node networks
• Support for multiple data formats including JSON, YAML, XML, and CSV files
• Open-source architecture built with TypeScript for extensibility and community contributions
• Web-based interface accessible through jsoncrack.com without installation requirements
• Real-time data structure exploration with clickable nodes and expandable sections
• Export capabilities for sharing visualized data structures with team members
Use Cases
• API developers debugging complex JSON responses and understanding nested object relationships
• DevOps engineers analyzing YAML configuration files for Kubernetes deployments and CI/CD pipelines
• Data analysts exploring CSV datasets and XML feeds to identify data structure patterns
• Frontend developers working with large state management objects in React or Vue applications
• Backend engineers documenting API schemas and database relationships for team collaboration
Why It’s Trending
This tool gained +43,789 stars this week, showing strong momentum in data visualization tools. This suggests increasing developer interest in visual approaches to understanding complex data structures. This trend may reflect a broader shift in how teams are building with data-intensive applications, prioritizing clarity and collaboration over traditional text-based debugging methods.
Pros
• Completely free and open-source with active community development
• Supports multiple popular data formats in a single unified interface
• No installation required – works directly in web browsers
• TypeScript foundation provides code reliability and developer-friendly contributions
Cons
• Limited to visualization functionality without data editing or transformation capabilities
• Performance may degrade with extremely large data files exceeding browser memory limits
• Dependency on web browser compatibility for advanced graph rendering features
Pricing
Completely free as an open-source project. No paid tiers or premium features.
Getting Started
Visit jsoncrack.com and paste your JSON, YAML, XML, or CSV data directly into the interface. The tool immediately generates an interactive graph visualization without requiring account registration or software installation.
Insight
The explosive growth pattern suggests that developers are increasingly prioritizing visual debugging tools over traditional text-based methods. This momentum likely reflects the growing complexity of modern application data structures, where nested APIs and configuration files exceed human parsing capabilities. The trend may indicate a broader shift toward visual-first development workflows, particularly as teams become more distributed and require clearer communication tools for technical concepts.


Comments