📊 Stats & Trend
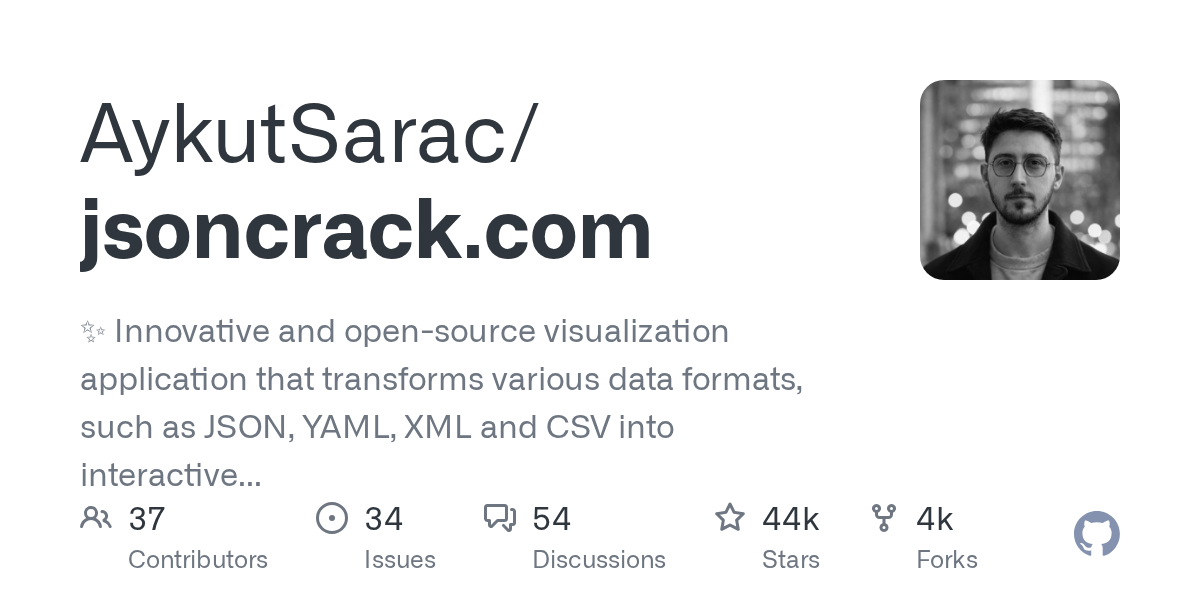
| ⭐ Stars (total) | 43,777 |
| 📈 Star Growth (Mar 17 → Mar 24) | +43,777 |
| 🔥 Star Growth (Mar 23 → Mar 24) | +9 |
| 🔥 Trend | Exploding |
| 📊 Trend Score | 35022 |
| 💻 Stack | TypeScript |
Overview
JSON Crack is experiencing explosive growth with +43,777 stars gained this week, marking it as one of the fastest-growing data visualization tools in the developer ecosystem. This open-source application transforms structured data formats including JSON, YAML, XML, and CSV into interactive, visual graphs that make complex data relationships immediately comprehensible.
Key Features
• Interactive graph visualization that converts text-based data formats into node-link diagrams
• Multi-format support covering JSON, YAML, XML, and CSV file types
• Real-time data transformation with immediate visual feedback
• Open-source architecture built with TypeScript for extensibility
• Web-based interface requiring no installation or setup
• Interactive nodes allowing users to explore nested data structures dynamically
Use Cases
• API developers debugging complex JSON responses and understanding data structure hierarchies
• DevOps engineers visualizing configuration files in YAML or XML format for infrastructure management
• Data analysts exploring CSV datasets to identify relationships and patterns before processing
• Frontend developers mapping out component data flows and state management structures
• Technical writers creating visual documentation for API schemas and data models
Why It’s Trending
This tool gained +43,777 stars this week, showing strong momentum in data visualization tools. This suggests increasing developer interest in visual approaches to understanding complex data structures. This trend may reflect a broader shift in how teams are building with data-heavy applications, prioritizing immediate visual comprehension over traditional text-based analysis.
Pros
• Completely free and open-source with active community development
• Supports multiple data formats in a single unified interface
• Requires zero installation with immediate web-based access
• Interactive exploration capabilities enhance understanding of nested data structures
Cons
• Limited to visualization functionality without data editing or transformation capabilities
• Performance may degrade with extremely large datasets or deeply nested structures
• Lacks advanced filtering or querying features for complex data analysis workflows
Pricing
Completely free as an open-source project with full functionality available immediately.
Getting Started
Visit jsoncrack.com and paste your JSON, YAML, XML, or CSV data directly into the interface for instant visualization. The tool generates interactive graphs immediately without requiring account creation or software installation.
Insight
The explosive weekly growth of +43,777 stars suggests that developers are increasingly seeking visual solutions for data comprehension challenges. This momentum likely reflects growing complexity in modern application data structures, where traditional text-based analysis becomes insufficient for rapid understanding. The trend indicates that visual data exploration tools may become standard components in developer workflows, particularly as APIs and configuration files grow more sophisticated.
Comments